
Summary
Overview

The summary shows you at a glance how many installations of this application there are in the selected environment and how many endpoints this application is installed on. You can set the time period at the top right in the Measurement area.
Measurement
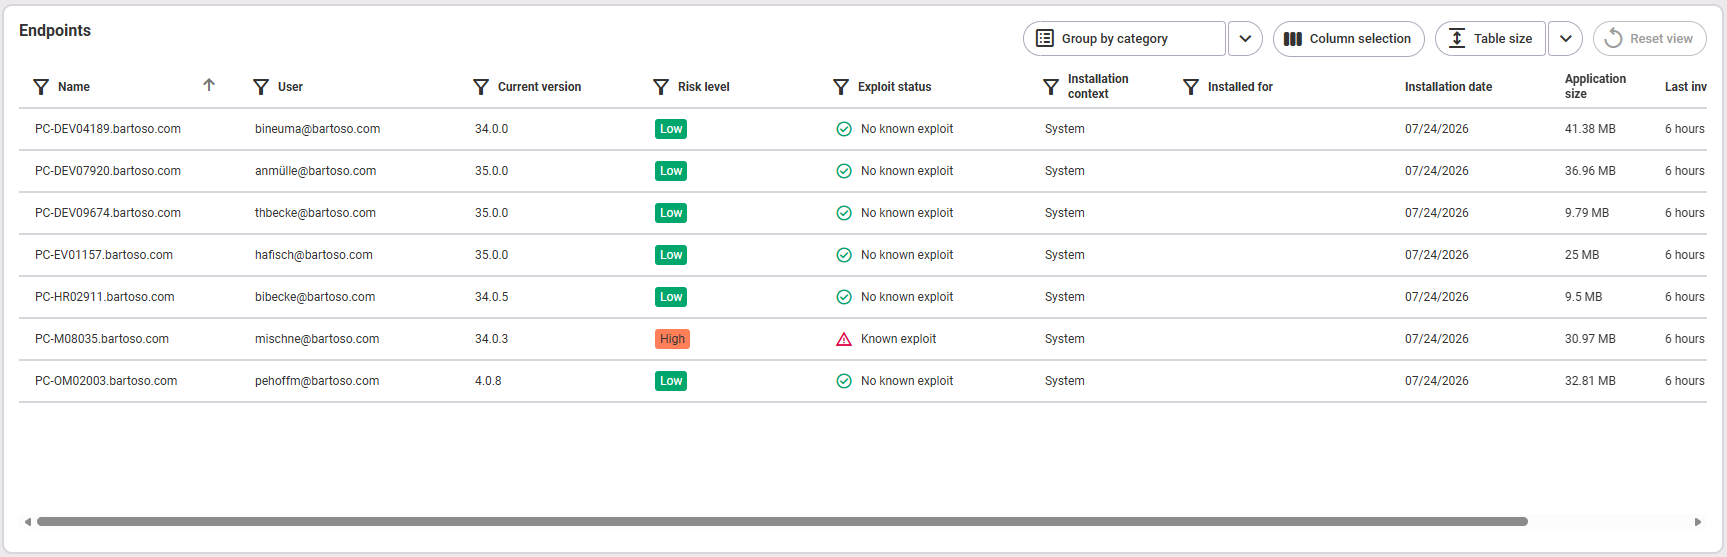
In the Measurement area, all endpoints of the selected environment on which the application is installed are listed. By default, the list is sorted alphabetically by endpoint name. Here you'll find an explanation of the table functions.
The following information is available for each endpoint, better say, installation:
- Name (of the endpoint)
- User (email of the user of the endpoint)
- Current version (currently installed)
- Installation context (user or system)
- Installed for (which user)
- Installation date
- Application size
- Last inventory (time)
Analysis
Distribution of versions {app name} over time
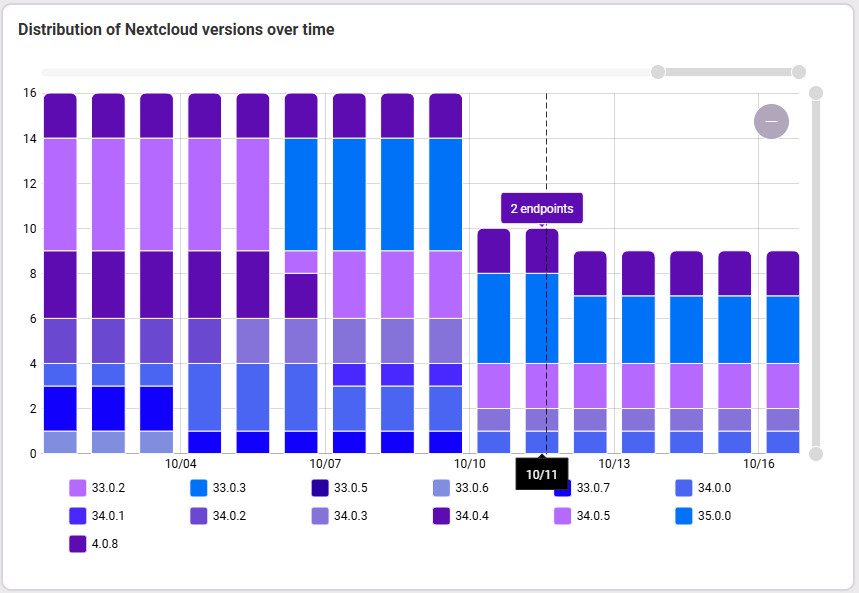
This graph shows the distribution of installed application versions over time. You can see which versions were installed on how many endpoints on each day. Hover your mouse over the lines in the chart to view detailed information about the number of endpoints and the corresponding date. Adjust the time period by zooming with the mouse wheel within the chart or using the gray zoom bar at the top.
Application stability of {app name} over time
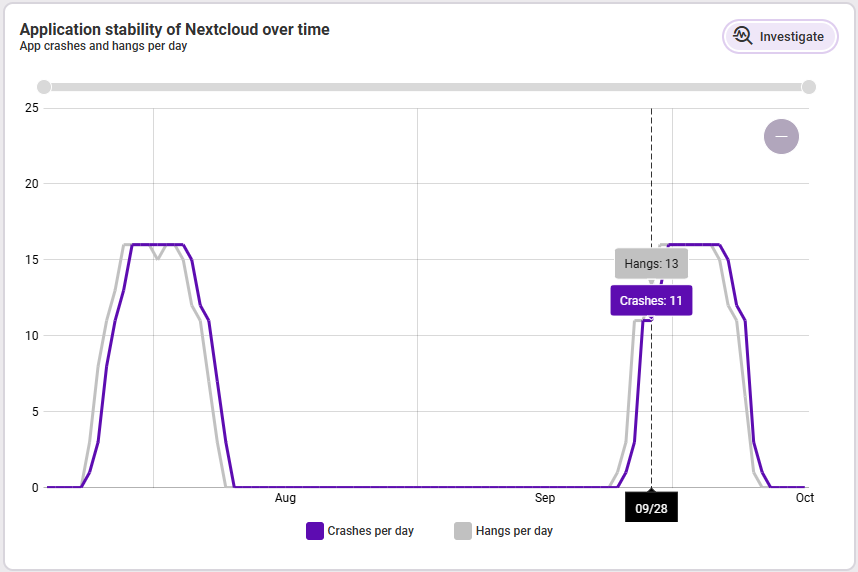
Here the stability of the installed application is shown graphically over time. You can see the progression of app hangs and app crashes over the selected period and recognize at a glance at which times there were anomalies. By hovering with the mouse over the lines in the diagram, you can obtain detailed information on the number of crashes and hangs on an exact date. Adjust the time period by zooming with the mouse wheel within the diagram or using the gray zoom bar at the top. The Investigate button takes you to the Stability section.
Distribution of {app name} versions
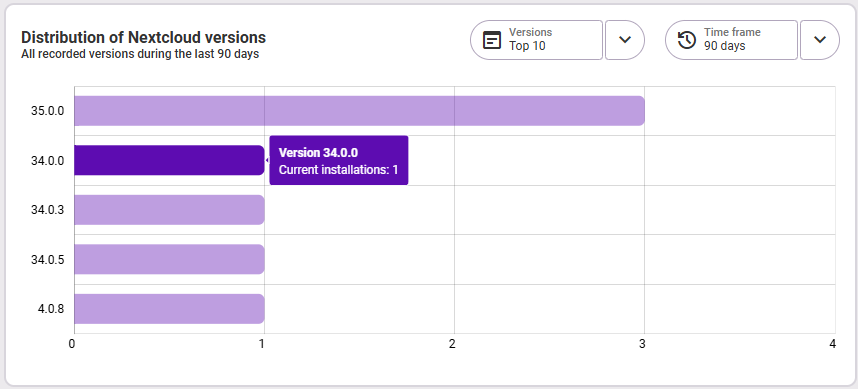
In this graphic you can see how the versions of the application installed in the selected period are distributed. All versions that were recorded in the selected time period (top right in the graphic) are displayed. By hovering over a version, you can see details on the version number and number of installations in the tooltip.