
User feedback

First select your active environment in the top right-hand corner. All environments to which you have access are available to you.
A global search function is available via the magnifying glass icon at the top.
Measurement
In the Measurement section, you will see all endpoints of the environment you have selected listed in the selected time period, sorted by the worst user feedback by default. Here you'll find an explanation of the table functions.
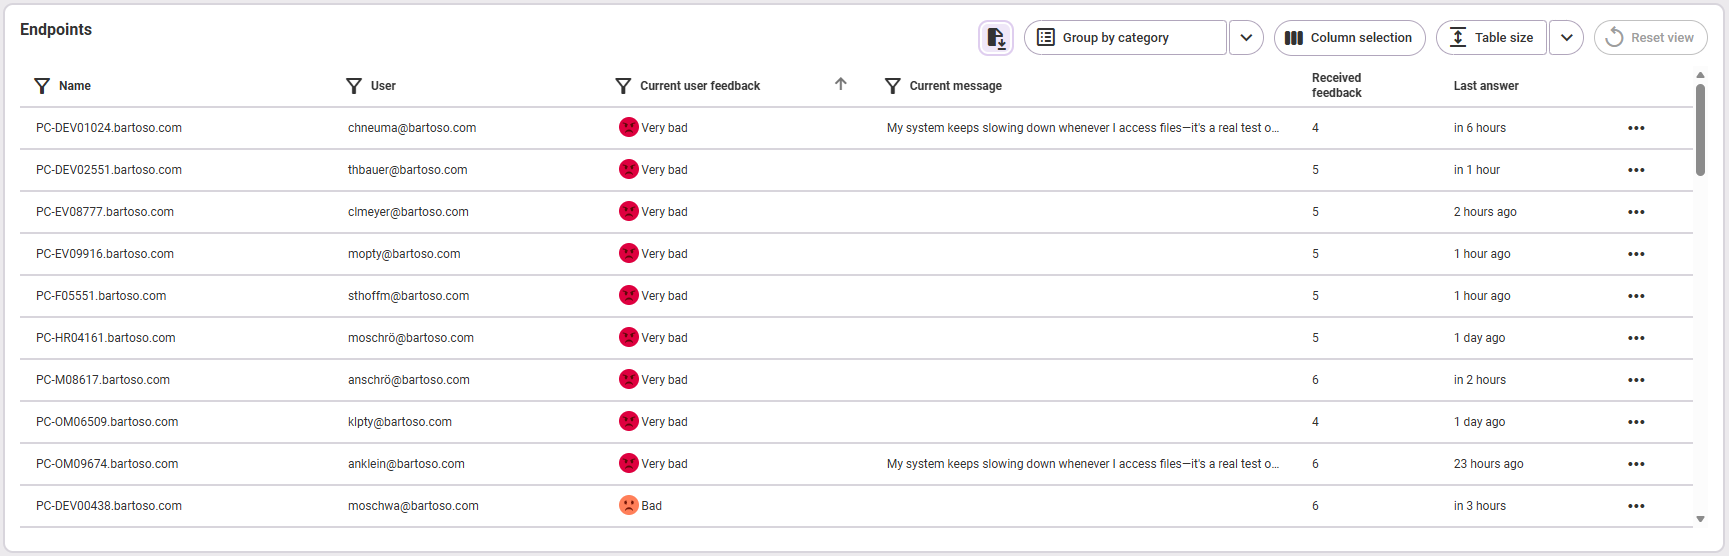
The following information is available:
- Name of the endpoint
- Name of the user (of the endpoint)
- Current user feedback (very bad, bad, good, very good, no feedback)
- Received feedback (information from the text field of the survey)
- Last answer (date of the last given answer)
Function: Forward feedback
Using the three-dot menu on the right-hand side of each table row, you also have the option of forwarding the feedback data for the respective endpoint to an email recipient. The settings for this can be found in the administration area under Adjust Feedback Settings and Adjust Action Settings.
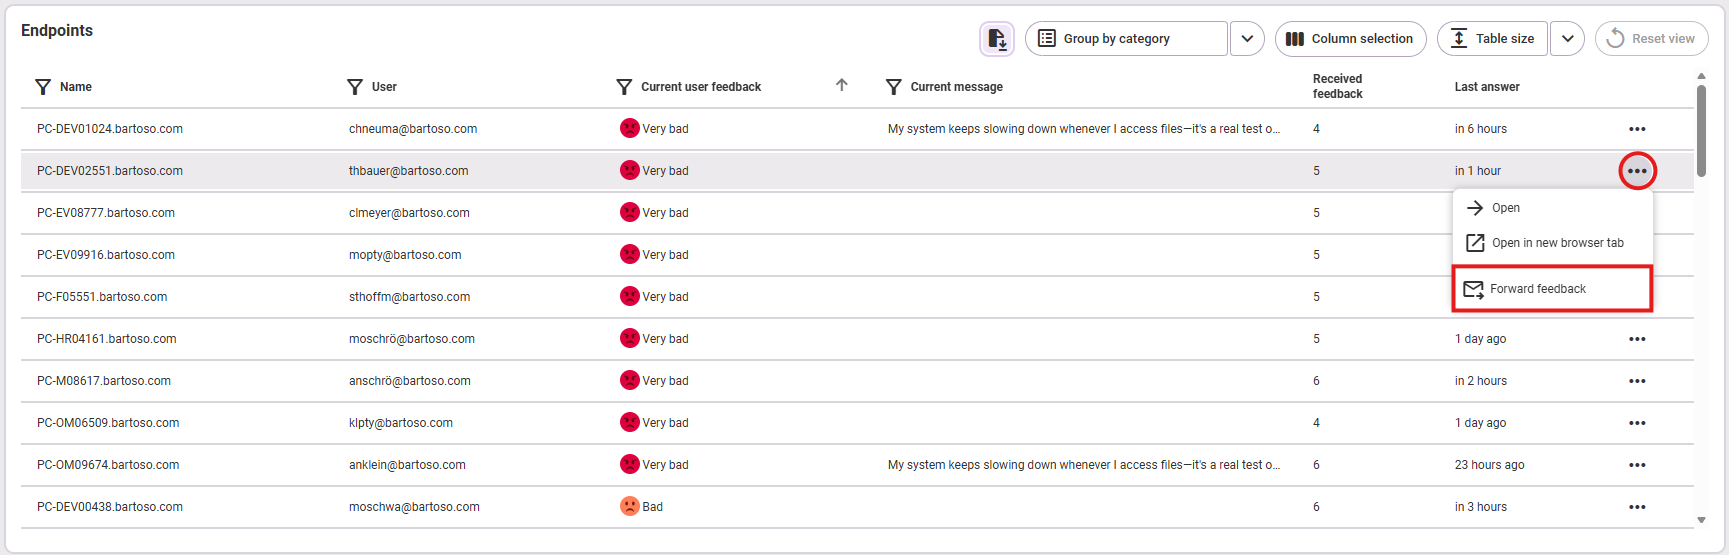
Clicking on Forward Feedback opens a dialog that allows you to edit the Subject and enter Additional information. By default, the subject is “User feedback analysis.” The following information is also listed for sending:
- Who is sending this email: The user's email is entered here.
- From which category of the baramundi Proactive Hub app do the data originate?
- What is the name of the endpoint from which the data originate?
- What is the name of the user of the endpoint from which the data originate?
- What is the feedback? (The smiley icon is not displayed in the email.)
- When was the feedback given?
- Did the endpoint user provide an additional message with the feedback?
Finally, click Send if you want to forward the feedback of the selected endpoint to the configured target address.
Note:
If the Forward data feature is not yet globally activated, a notice will appear when attempting to send. An environment administrator must first activate the feature in the administration area under Adjust Action Settings.
Analysis
The analysis area is divided into different views that display the user feedback in different ways.

Average user feedback over time
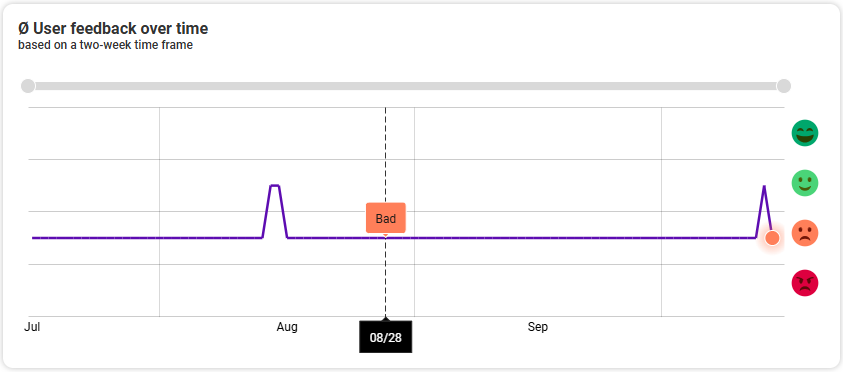
This graphic shows (as in the Summary area) the average user satisfaction over time (determined over two weeks). By using the mouse wheel or the gray slider at the top of the graph, you can zoom in to one day. The tooltip shows you what the feedback was like on a specific day within the two weeks.
User feedback - Worst 10 endpoints
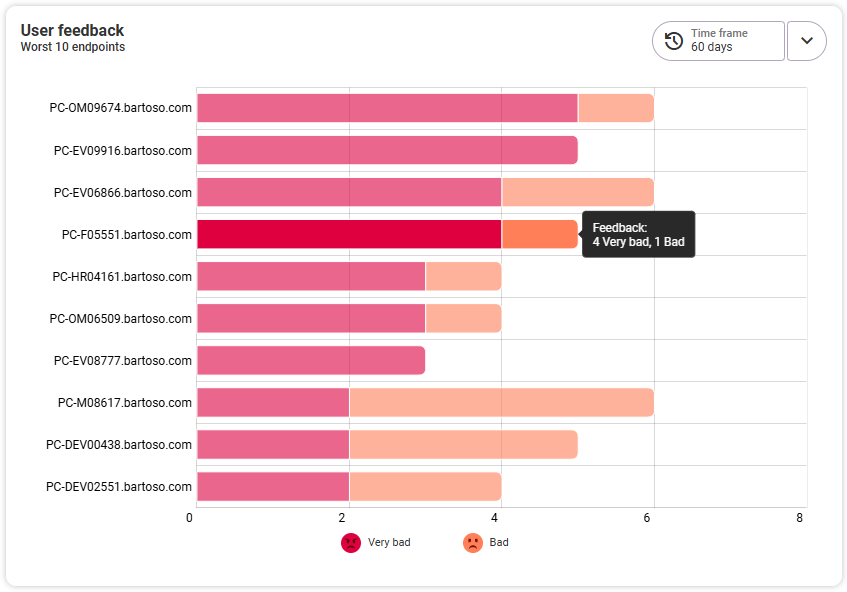
This chart lists the top ten worst-rated endpoints in the selected period. Clicking on an endpoint takes you to its detailed view. The tooltip shows you how the feedback is made up.
User feedback in feedback cycle
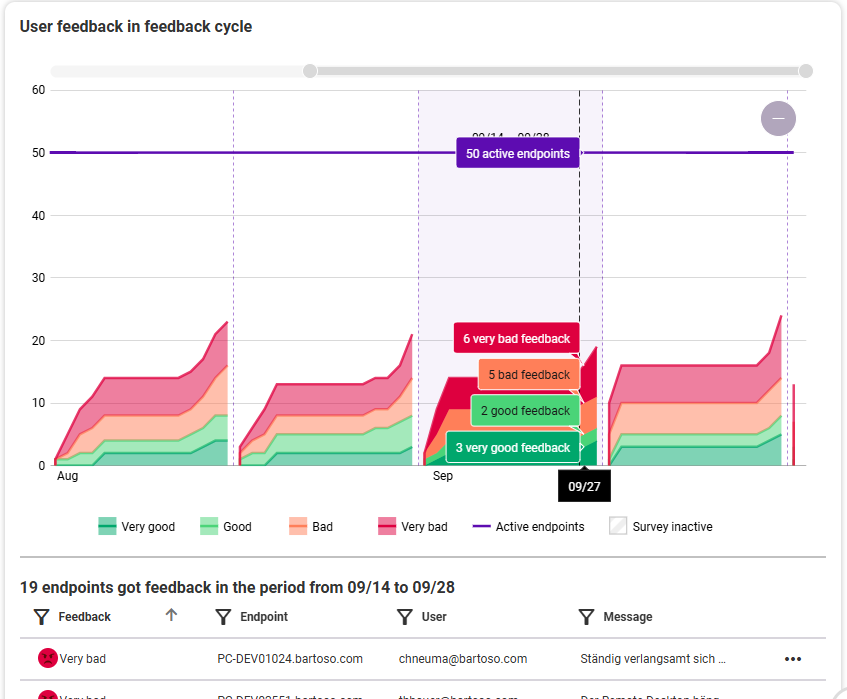
Here you can see the user feedback displayed in the periodic processes of the set feedback cycle. By hovering with the mouse over the time ranges, you can obtain details on this period or day, divided into the different feedback levels. The total number of endpoints is shown by the dashed line. By using the mouse wheel or the gray slider at the top of the graphic, you can zoom in to one day.
Clicking on the graphic opens a table below. This shows all endpoints that have received feedback from users in the selected time period.
Current user feedback over all endpoints with feedback
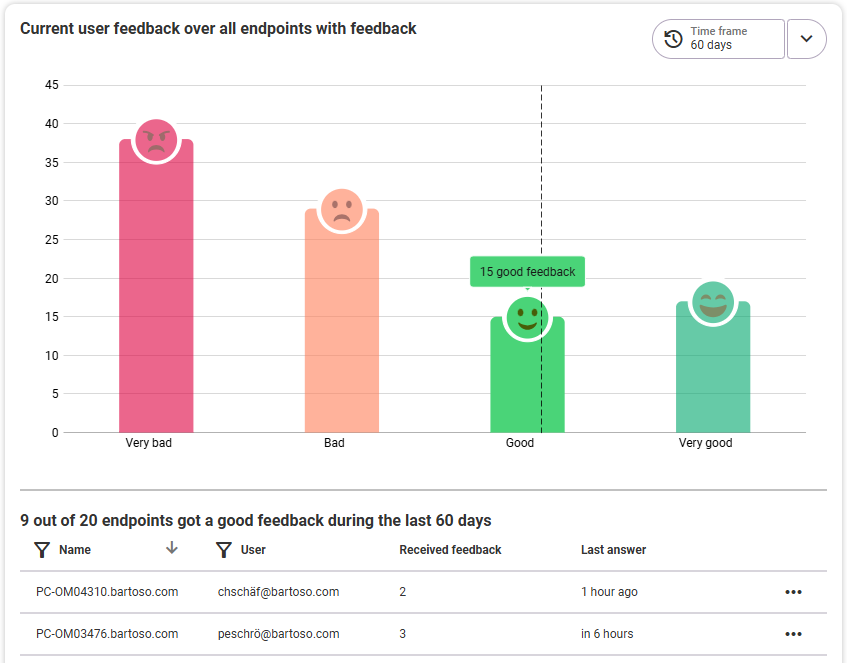
In this diagram, the user feedback over the selected time period is divided into the different evaluation levels. It provides a quick overview of which and how many endpoints have received very bad, bad, good or very good feedback. Click on one of the evaluation levels to see the corresponding endpoints listed below. By hovering with the mouse over the individual levels, you can see the total number of endpoints in this level. Click on a device in the list of endpoints below or select the three-dot menu to see this endpoint in the detailed view.