
Security (Preview)
Usage
Use the Security section to identify and prioritize security-related risks in your environment early on. At a glance, you can see which endpoints and applications are affected by known vulnerabilities, for which vulnerabilities known exploits exist, and where updates are available to minimize risk. This allows you to specifically identify particularly critical risks and take appropriate action.
First, select your active environment in the upper-right corner. All environments to which you have access are available.
The magnifying glass icon at the top provides access to a global search function.
Note:
To view the Security feature, you need the baramundi Proactive Hub Advanced license.
Overview

The overview tile shows you the following aggregate figures within your environment:
- Endpoints at high or critical risk
- Exploitable endpoints
- Updateable endpoints
Risk level and exploit status
There are four risk levels ranging from 0 to 100:
- Low (0–39)
- Medium (40–69)
- High (70–89)
- Critical (90–100)
Software with no known vulnerabilities is also classified as “Low” risk, since all software has potential (and possibly as-yet-unknown) vulnerabilities.
The Exploit status describes the extent to which a (known) vulnerability is being exploited. There are indications that the vulnerability is either already being actively exploited or that a “proof-of-concept exploit” has been published. We distinguish between the following statuses:
- Known exploit
- No known exploit
Measurement
In the Measurement section, you’ll see all endpoints in your selected environment listed, sorted by default by the highest risk level.
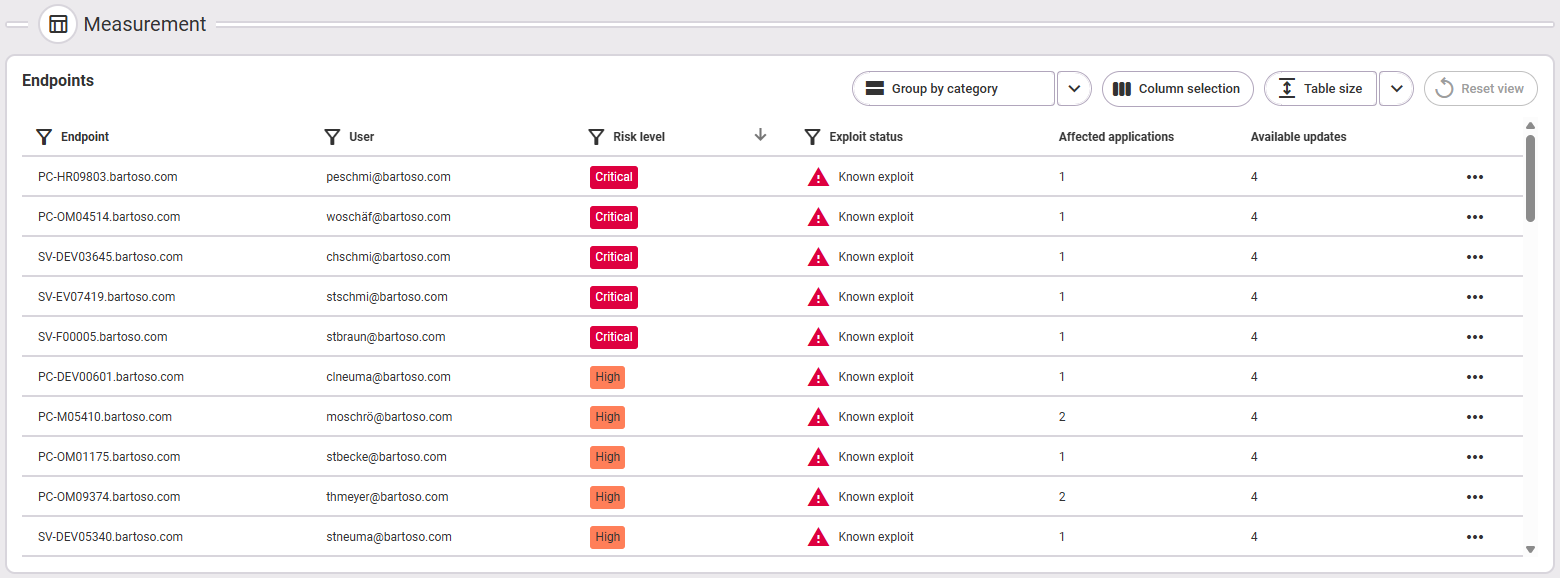
The following information is available:
- Endpoint name
- User name (of the endpoint)
- Risk level (Low, Medium, High, Critical)
Note: The system always displays the current highest risk level of the applications installed on the endpoint. - Exploit status (Known exploit or No known exploit)
- Affected applications (number)
- Available updates (number)
Analysis
Top 10 endpoints at risk
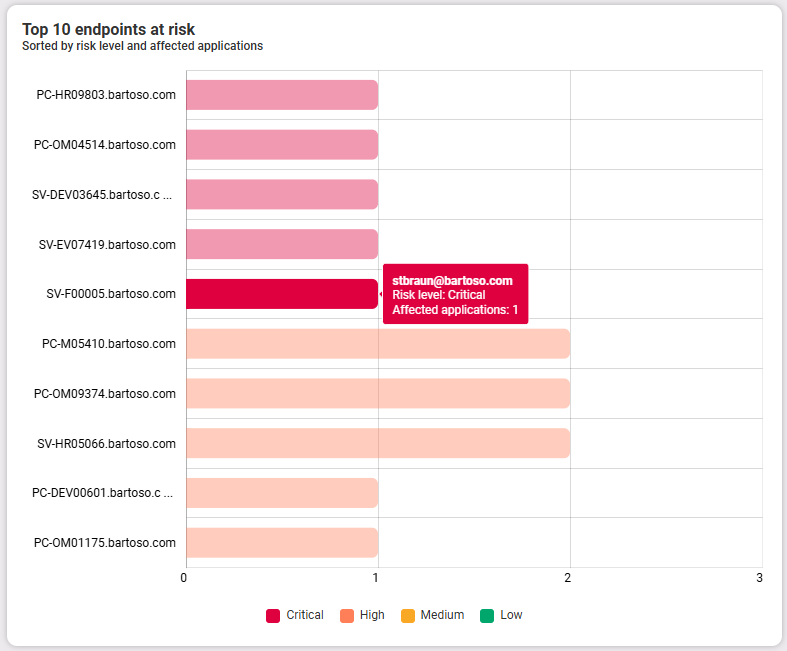
This chart lists the top ten endpoints with the highest risk levels. The tooltip shows you the exact risk level, the user of this endpoint, and how many applications on this endpoint are affected by this risk level. Clicking on an endpoint takes you to its detailed view.