
Summary
These overview tiles show you the most important values at a glance. By clicking on one of the tiles (except Software inventory and Installed applications), you can navigate directly to the respective detail page, which contains detailed information about this area.
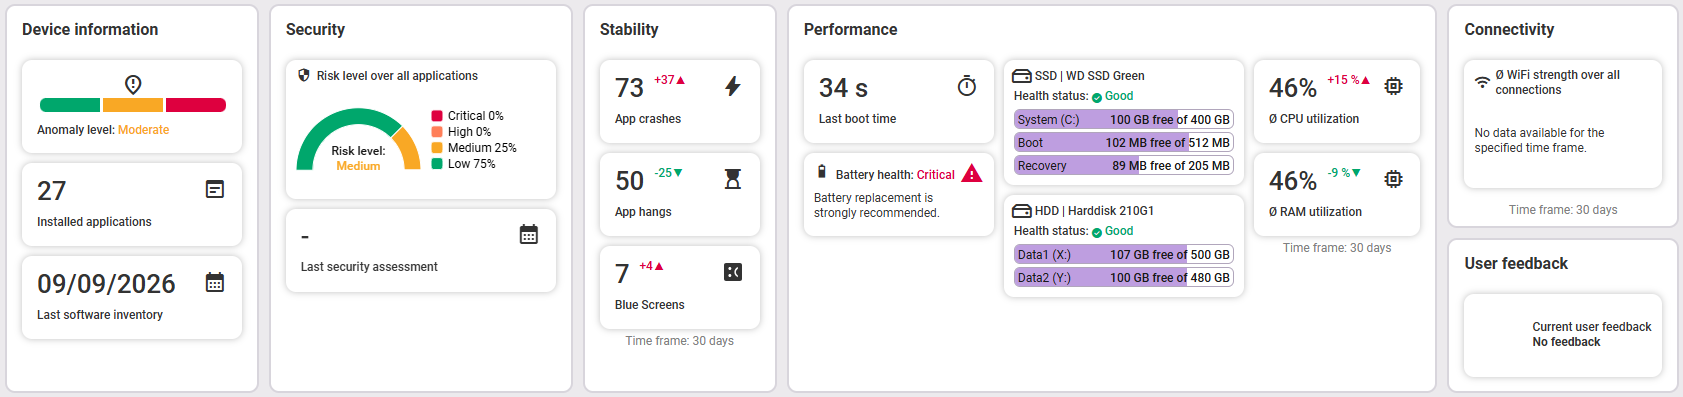
- Device Information shows
- the current anomaly level (high = red, moderate = orange, normal = green)
- the number of applications installed on this endpoint
- the date of the last software inventory
- Security displays the average risk level as well as the distribution of risk levels (Critical, High, Medium, and Low) over all applications. It also shows the date of the last security assessment.
- Stability shows app crashes, hangs, and blue screens over a 30-day period. The small superscript number shows the trend compared to the previous 30 days.
- Performance shows the average boot time and battery health of the device, as well as the average CPU and RAM utilization in percent with their current trend (small superscript number). The CPU and RAM data refers to a time frame of 30 days. In the center, you can see an overview of the endpoint's hard drives with their names, status, and currently available storage capacity.
- Connectivity shows you the average WiFi strength across all connections as a percentage and color-coded. If you hover your mouse over the diagram sections, you will see the exact percentage of each section in the tooltip. To the right of this, the list of all areas shows you the exact distribution of the percentage points. The tooltip shows you the explanation of where an area ranges from (in percent).
- User feedback shows the last user feedback.
General device information
Hardware
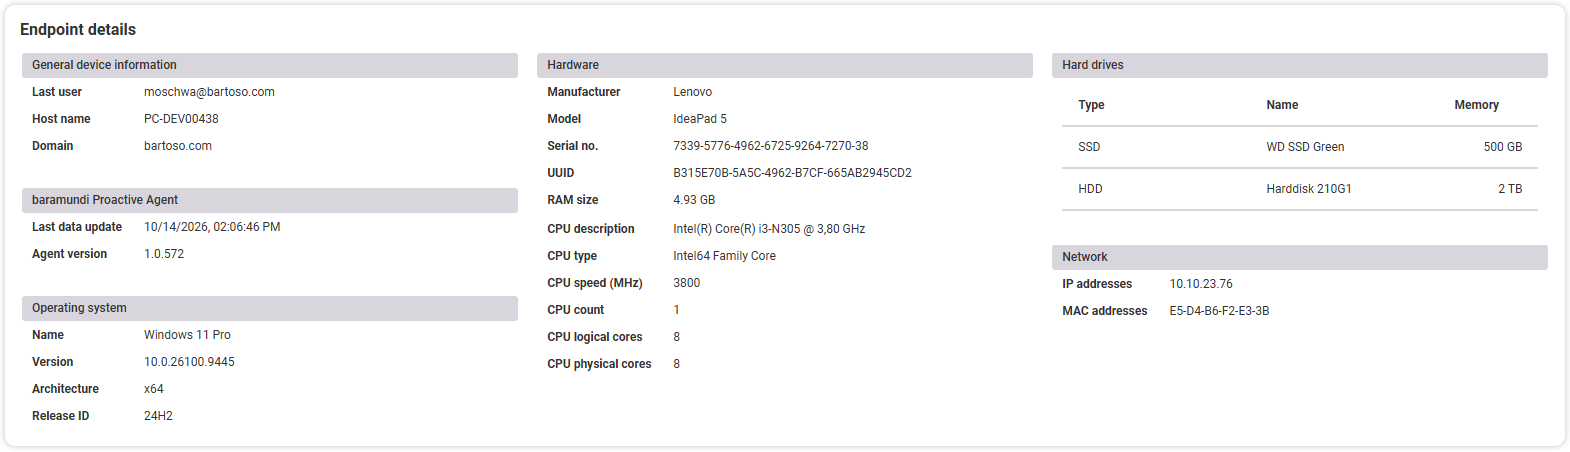
In the Hardware section you can see an overview of the relevant technical information on the selected endpoint:
- General device information
- baramundi Proactive Agent
- Operating system
- Hardware
- Hard drives
- Network
Software
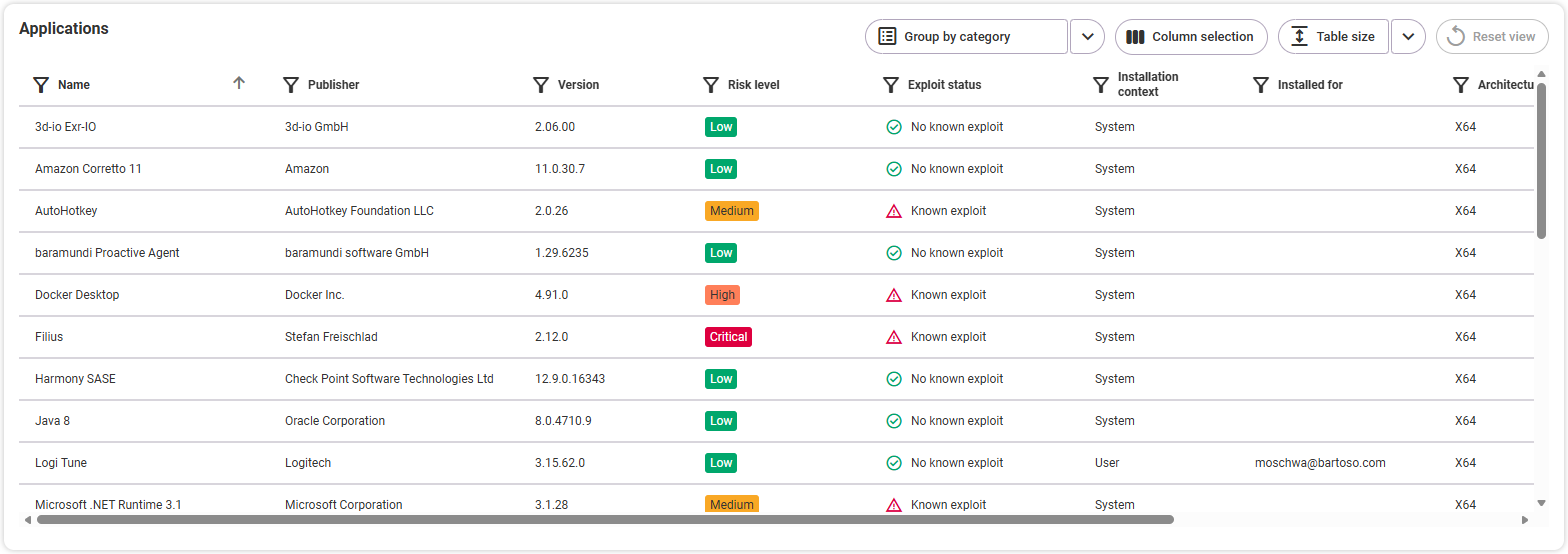
Under the Software tab, you will find a list of all applications installed on the selected endpoint, sorted alphabetically by default. Here you'll find an explanation of the table functions.
The following details are available for each application:
- Name
- Publisher
- Version
- Risk level (Security feature, part of baramundi Proactive Hub Advanced license)
- Exploit status (Security feature, part of baramundi Proactive Hub Advanced license)
- Installation context (user or system)
- Installed for (which user)
- Architecture (of the application)
- Installation date
- Application size
Sorting Sort the data in descending or ascending order by clicking on the respective column heading or on the small arrow to the right of the column heading.
Free text filter If there is a filter icon in front of the column heading, this column contains a free text filter option: To do this, click on the column header and search for words or parts of words within the selected column.
Click on one of the applications to open it in the detailed view. Via the three-dot menu on the right-hand side of the line, you can also open the detailed view in a new tab.
Customize columns Select your desired columns here, change the order or remove unneeded columns. The Reset view button resets the table to the original view.