
Security (Preview)
Usage
Use the Security section to assess the security status of the selected endpoint and identify the causes of increased risk. At a glance, you can see which installed applications are affected by known vulnerabilities, for which vulnerabilities known exploits exist, and where updates are available to minimize risk. In addition, you can track the endpoint’s risk assessment over time and analyze the underlying vulnerabilities down to the CVE level. This allows you to prioritize security-related risks in a targeted manner and determine appropriate countermeasures.
Note
To view the Security feature, you need the "baramundi Proactive Hub Advanced" license.
Overview

The overview tile shows you the following aggregate figures for the selected endpoint:
- Applications at high or critical risk
- Exploitable applications
- Updateable applications
Risk level and exploit status
There are four risk levels ranging from 0 to 100:
- Low (0–39)
- Medium (40–69)
- High (70–89)
- Critical (90–100)
Software with no known vulnerabilities is also classified as risk level “Low” since all software has potential (and possibly as-yet-unknown) vulnerabilities.
The exploit status describes the extent to which the (known) vulnerability is being exploited. There are indications that the vulnerability is either already being actively exploited or that a proof-of-concept exploit has been published. We distinguish between the following statuses:
- Known exploit
- No known exploit
Measurement
In the Measurement section, you’ll see a list of all applications for the endpoint you selected, sorted by default by the highest risk level. Here you'll find an explanation of the table functions.
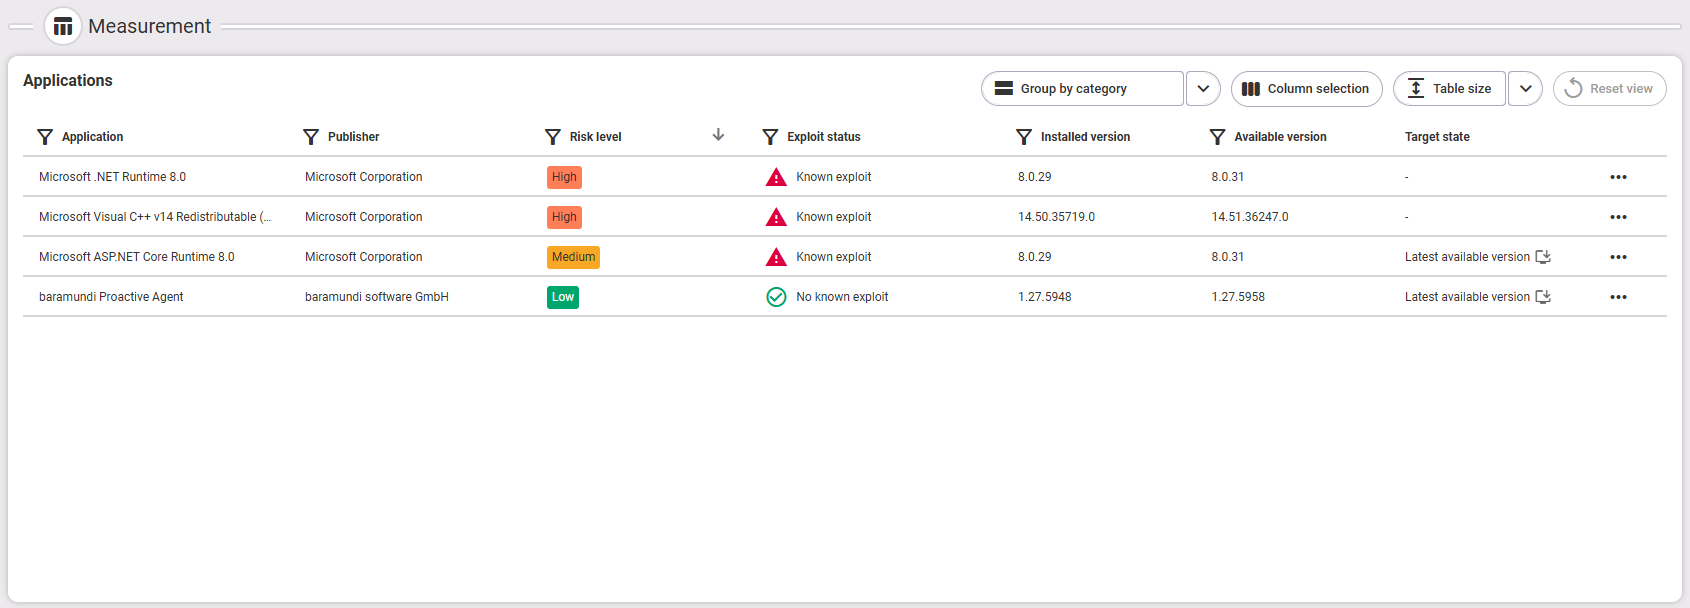
The following information is available:
- Application name
- Publisher name (of the application)
- Risk level (Low, Medium, High, Critical)
- Exploit status (Known exploit or No known exploit)
- Installed version
- Available version
- Target state (none (-), Uninstall and keep uninstalled, or Latest available version)
Analysis
In the analysis section, you can see the Risk score of [selected endpoint] over time as well as details about Known vulnerabilities.
Risk score of [selected endpoint] over time
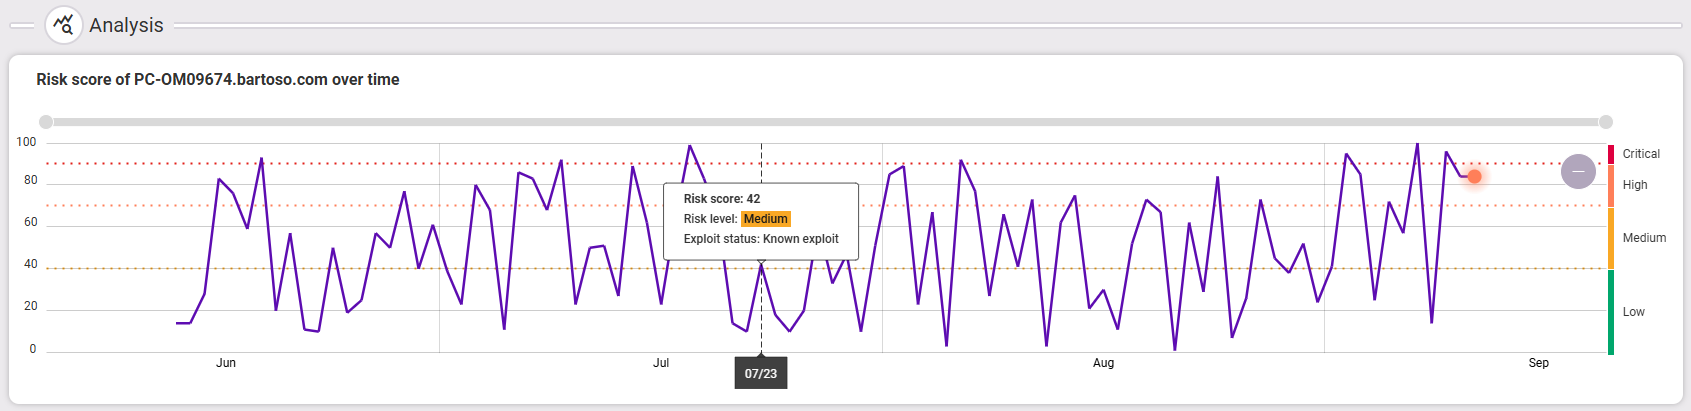
The chart shows the risk assessment of the selected endpoint over time. The assessment is conducted daily and displays the last recorded risk level for that day.
The y-axis displays the risk levels (Low, Medium, High, and Critical) with a risk score ranging from 0 to 100; the x-axis shows the timeline (months/days). The tooltip displays the detailed information for each day: risk score, risk level, and exploit status.
You can adjust the time display by using the mouse wheel to zoom in or out on the chart. Alternatively, you can use the gray scroll bar above the chart. After zooming in, a “minus” button appears on the chart; clicking it allows you to zoom all the way out.
Known Vulnerabilities
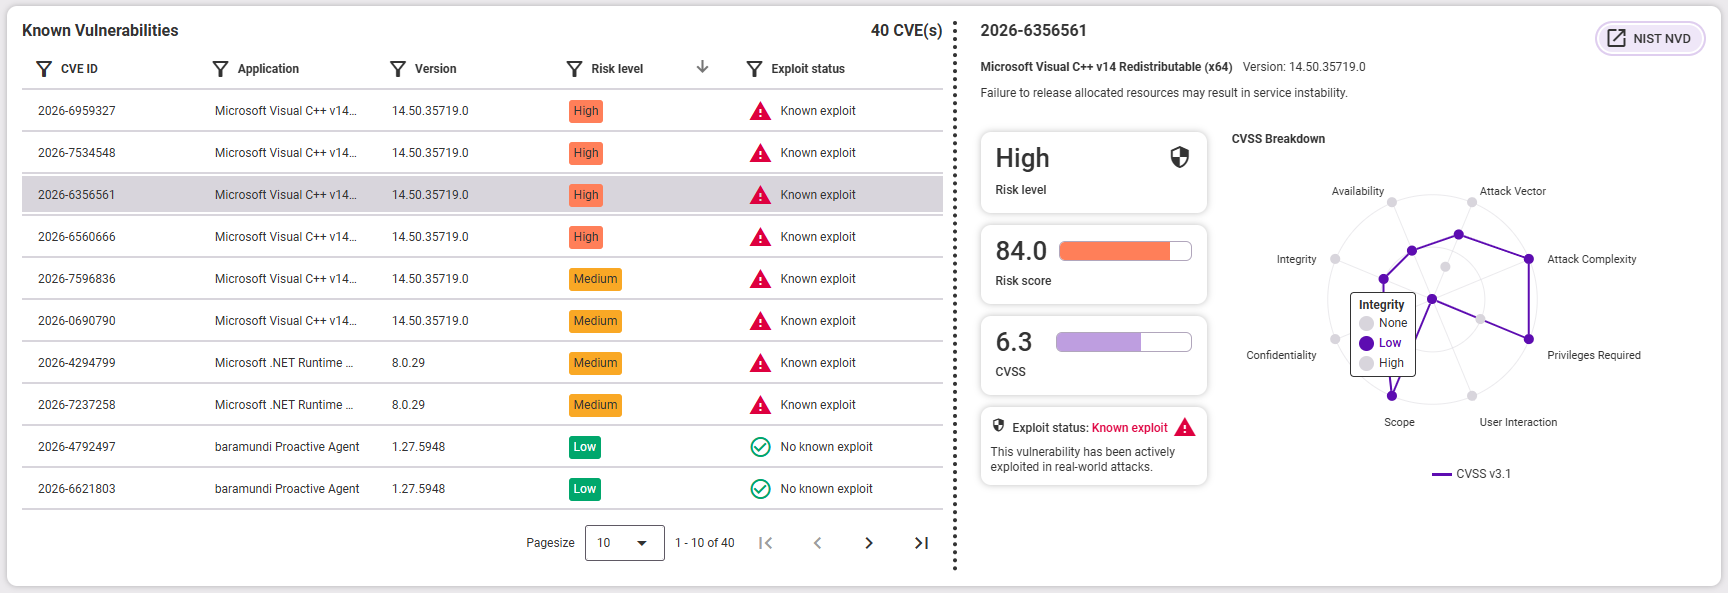
In this section, the table on the left lists all vulnerabilities detected on this endpoint, sorted by default by risk level (descending). As with all other tables, you can filter and sort the data here. If there are more than ten vulnerabilities, the table spans multiple pages.
The total number of all known CVEs (vulnerabilities) is displayed above the table.
The following information is available for each vulnerability:
- CVE ID (vulnerability ID)
- Application name
- Application version (currently installed)
- Risk level (Low, Medium, High, Critical)
- Exploit status (Known exploit or No known exploit)
When you select an application from the table, you’ll see the vulnerability details on the right:
- CVE ID (vulnerability ID)
- “NIST NVD” button (Link leads directly to the NIST vulnerability description)
- Application name
- Application version (currently installed)
- Vulnerability description
- Risk level
- Risk score
- CVSS score 0.0–10.0
- Exploit status
- Graph showing CVSS breakdown (more on CVSS here)
CVSS breakdown:
The chart is based on the CVSS v3.1 standard. You can find details on understanding the vector components here.
There are a total of eight base metrics, all of which are necessary to calculate the CVSS vector. As a rough guideline for the points in the graph: The farther out a point is, the greater the risk associated with that component. For example: If the Attack Complexity is low, the point is located far on the outside, since an attacker can reach the target using simple measures. High Attack Complexity requires a high degree of attack measures and is therefore generally associated with a lower risk.
Exploitability metrics:
- Attack Vector
- Attack Complexity
- Privileges Required
- User Interaction
- Scope
Impact Metrics:
- Availability
- Integrity
- Confidentiality